In this demo, we demonstrate the strenght of our resource, and giving
you the ability to query it.
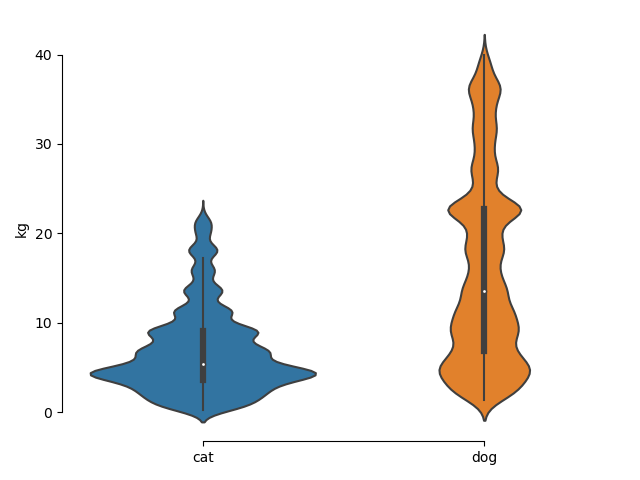
You can enter whatever terms you choose, a physical dimension along one
of those which are supported and observe what the distribution we collected
for these terms are. We present these distribution using
violin plots.
Furthemore, you can also enter an integer, for removing
outliers. As the technique we used to collect these distributions is noisy,
there are noisy values to each distribution as well, so by filtering the
distribution tips, a more clean and comparable distribution can be viewed.